


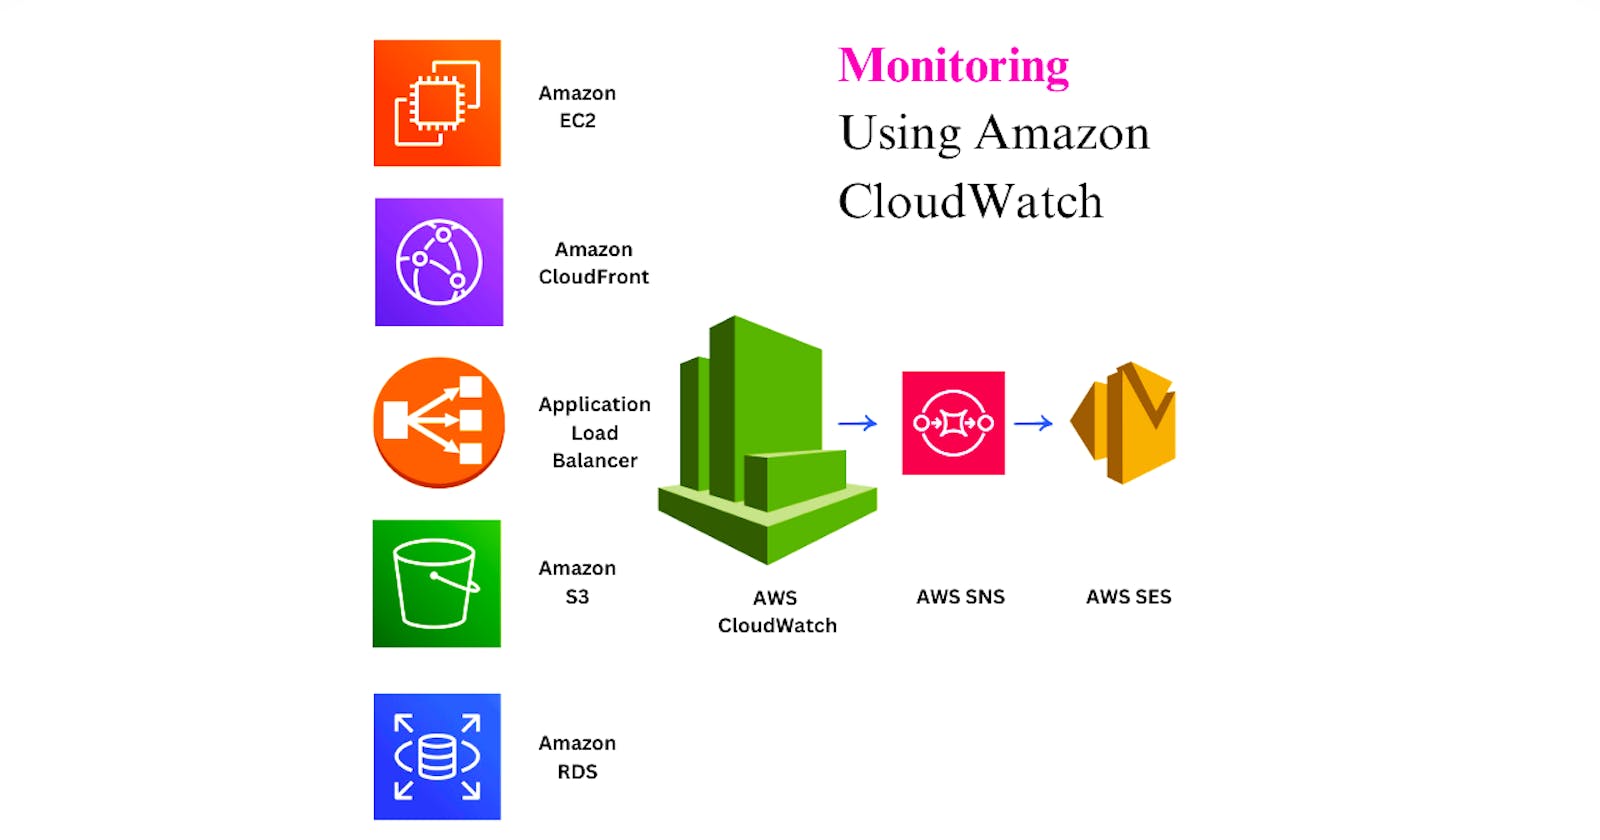
In this article we will explore monitoring using AWS CloudWatch and creation of CloudWatch alarms for various AWS services leveraging AWS SNS (Simple Notification Service) and SES (Simple Email Service) to send emails to the team.
Prerequisite:
AWS account
Basic understanding of different AWS services
Monitoring is a method of keeping an eye on your infrastructure. If something fails or breaches occur, you should receive a notification. Amazon CloudWatch collects various metrics, and based on the thresholds set, it triggers an alarm. These alarms can then initiate automated actions if already set up, or else send notifications.
For instance, suppose you have deployed an application on an EC2 instance, but suddenly, the traffic to your application surges beyond what your instance can handle. In such situations, creating alarms for EC2 allows you to monitor the instance's performance. When the traffic exceeds a certain limit, these alarms can alert you or automatically increase the size of the instance. This scaling up enhances your application's performance and availability to meet the increased demand.

OK State: The OK state indicates that the monitored metric is within the acceptable range and has not breached the defined threshold.
ALARM State: The ALARM state indicates that the monitored metric has breached the defined threshold. When the metric enters the ALARM state, CloudWatch triggers the associated alarm, and any configured alarm actions are executed.
INSUFFICIENT_DATA State: The INSUFFICIENT_DATA state indicates that there is insufficient data to determine the state of the alarm. This state typically occurs when CloudWatch does not have enough data points to evaluate the metric against the defined threshold.
Important terminologies in CloudWatch:
📈Metrics: Metrics in CloudWatch are variables that represent specific data points or measurements about performance of AWS resources. These metrics are continuously collected and monitored by CloudWatch. For example CPUUtilization, MemoryUtilization, and DatabaseConnections are some of the metrics.
⏰Alarms: Alarms allow you to set thresholds on metrics. When a metric breaches the threshold, CloudWatch triggers an alarm, enabling you to take proactive actions or receive notifications. For example when CPU utilization is more than 80% trigger an alarm.
📉Thresholds: Thresholds are predefined values that you set on metrics to define acceptable performance ranges for your AWS resources. For example, you might set a threshold for CPU utilization at 80% or 90%.
⏳Period: The period refers to the length of time over which CloudWatch aggregates data points for a specific metric.
⏲️Evaluation Period: The evaluation period determines the number of consecutive data points that must breach the alarm threshold before CloudWatch triggers the alarm. For example if we set the evaluation period to 3 for a 5-minute period, CloudWatch requires three consecutive 5-minute data points to breach the threshold before triggering the alarm.
📄Namespaces: Namespaces are containers for metrics, categorizing them based on their origin or source. For example, AWS services have their own namespaces like "AWS/EC2" or "AWS/S3".
💹Datapoint: Data points represent specific values or measurements of a metric at a particular point in time. For example we have an EC2 instance running a web server and CloudWatch collects data at every minute so data point indicates that at this hour of this day, the CPU utilization of the EC2 instance was X%
Step 1:Create Amazon SNS topic:
In the AWS account services, search for SNS. Go to Topics in side bar and click Create topic, select type as Standard, enter a topic name and click create topic.

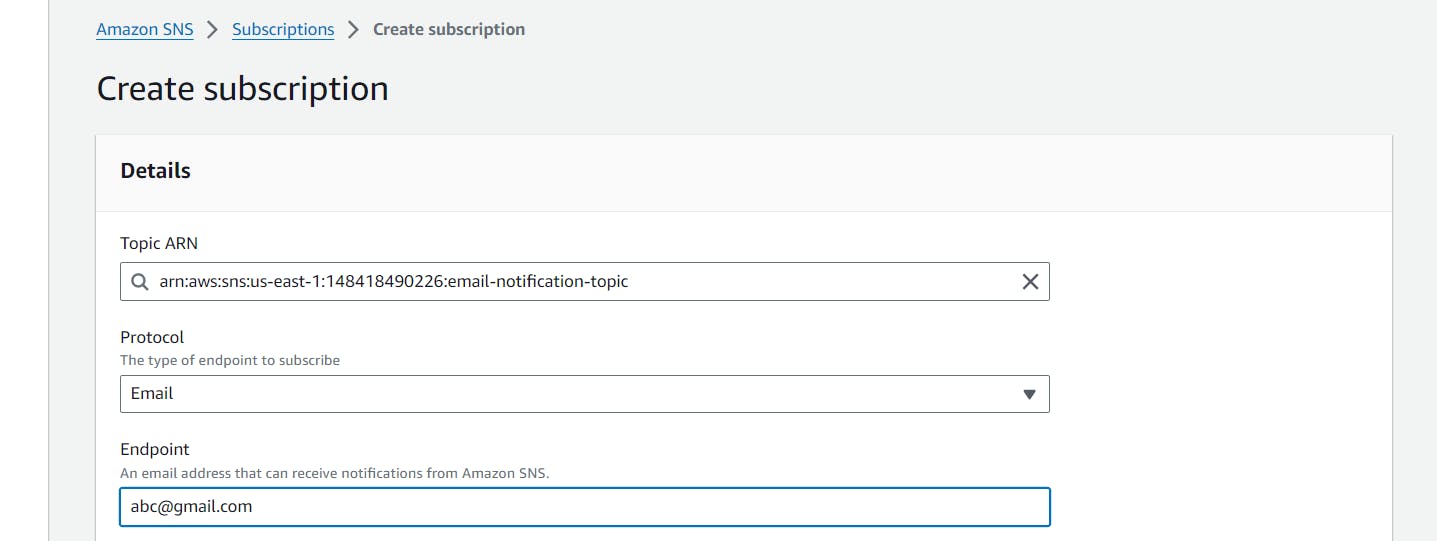
Step 2: Subscribe to SNS topic
Go to Subscriptions in the left panel, click Create subscription, choose your SNS topic ARN, select protocol as Email and enter the email addresses of your team members. Team will receive a confirmation email to confirm their subscription.
Step 3: Setup SES for sending emails
Go to AWS services and search for SES and verify the email addresses or domains that you want to send emails from. Once done go to your email and confirm the email address verification.

Step 4:Create CloudWatch alarm for EC2
Go to AWS services and search for CloudWatch, In the left navigation pane, click on All alarms, then click Create Alarm, Select the metric you want to monitor (e.g., CPU utilization for an EC2 instance).

Select statistics, Period, and threshold. Select existing SNS topic and click Next, enter Alarm name and click Create Alarm.

When CPUUtilization threshold is crossed, alarm will be triggered and you will receive an email notification.


Below is the email notification received on verified email:

Important metrics for Monitoring AWS services
Metrics to monitor for EC2:
Elastic compute cloud (EC2) is a web services that enable users to rent virtual servers, known as instances, along with other computing resources.
CPU Utilization: CPU utilization indicates how much of the CPU resources are being utilized by your EC2 instances.
Memory Utilization: Monitoring utilization metric ensure that your instances have enough memory available to handle the workload efficiently.
Network Traffic: Monitoring inbound and outbound network traffic helps identify trends and anomalies in data transfer.
Disk I/O: Monitoring Disk I/O metrics provide insights into how much data is being read from and written to the instance's storage volumes.
Disk Utilization: Monitoring disk space usage helps prevent instances from running out of storage capacity, which can lead to application failures or downtime.
Metrics to monitor for CloudFront:
Amazon CloudFront is a content delivery network (CDN) service provided by Amazon Web Services (AWS) that helps distribute content to users globally with low latency and high transfer speeds.
Requests: Monitor the total number of requests served by CloudFront.
Data Transfer: Track the volume of data transferred by CloudFront.
HTTP Status Codes: Monitor HTTP status codes returned by CloudFront. This includes 2xx, 3xx, 4xx, and 5xx status codes. An increase in 4xx or 5xx errors might indicate issues that need attention.
Origin Response Time: Track the time taken by the origin server to respond to CloudFront requests. High response times can impact overall latency and user experience.
Error Rate: Monitor the rate of errors encountered by CloudFront, increase in error rates may indicate underlying issues with content delivery or origin servers.
Metrics to monitor Application Load Balancer:
Application Load Balancer (ALB) distributes incoming application traffic across multiple targets, such as Amazon EC2 instances, containers, and IP addresses, within one or more Availability Zones.
Request Count: Total number of requests handled by the ALB over time. This metric helps you understand the traffic volume your application is receiving.
Healthy Host Count: Track the number of healthy instances registered with the ALB's target groups.
Unhealthy Host Count: Track the number of unhealthy instances registered with the ALB's target groups.
Latency: Monitor the latency of requests processed by the ALB. Latency metrics provide insights into the responsiveness of your application.
HTTP Error Rates: Track the rate of HTTP 4xx and 5xx error responses returned by the ALB.
Active Connection Count: Monitor the number of active connections to the ALB over time. This metric helps you understand the level of concurrent connections your application is handling.
Target Response Time: Track the response time of backend instances when responding to requests forwarded by the ALB.
Metrics to monitor Amazon S3:
Amazon Simple Storage Service (S3) is a storage service that provides object storage through a web service interface.
Bucket Size: Monitor the total size of objects stored in each S3 bucket. This can help understand your storage utilization.
Number of Objects: Track total number of objects stored in each S3 bucket. Monitoring object count helps you manage your data and identify any unexpected increases or decreases in the number of objects.
Request Metrics: Monitor various S3 request metrics, including the number of GET, PUT, POST, DELETE, and LIST requests made to each bucket.
Data Transfer Metrics: Track the amount of data transferred in and out of each S3 bucket.
Bucket Access Metrics: Monitor access metrics such as the number of requests from different AWS services and different regions made to bucket.
Metrics to monitor Amazon RDS:
Amazon Relational Database Service (RDS) is a web service that makes it easy to set up, operate, and scale a relational database in the cloud.
CPU Utilization: Monitor the CPU utilization of your RDS instances to ensure that they have sufficient processing power to handle the workload.
Database Connections: Track the number of active database connections to your RDS instances.
Read and Write IOPS: Monitor the read and write I/O operations per second for your RDS instances.
Storage Usage: Keep track of the amount of storage used by your RDS instances.
Free Storage Space: Monitor the amount of free storage space available in your RDS instances.
Database Throughput: Monitor the throughput of data flowing in and out of your RDS instances.
Database Latency: Monitor the latency of database queries and transactions.
Thank you for taking time to read my article. If I've overlooked any steps or missed any details, please don't hesitate to get in touch.
Feel free to reach out to me anytime Contact me
~ Palak Bhawsar ✨